For beginner users of Power BI for RuleFour here are some useful tips I have recently learned:
-
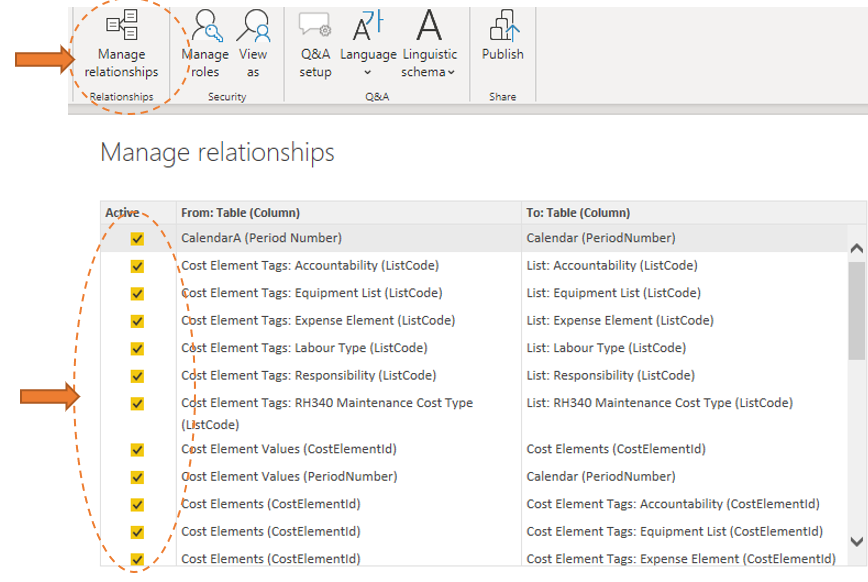
If Power BI visuals are not filtering as expected check that all the Relationships in Power BI Schema are marked active via the Manage Relationships button in the ribbon
-
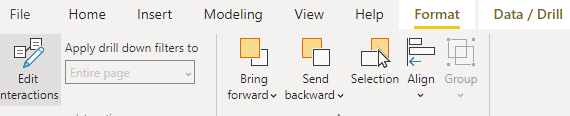
Another reason filtering might not be working is due to how the interactions between visuals have been set up on your page. Click on each visualisation and go to Format>Edit Visualisations. Click between the filter, highlight and neither icons for all the other visualisations on the page. Repeat for all visuals on page.
-
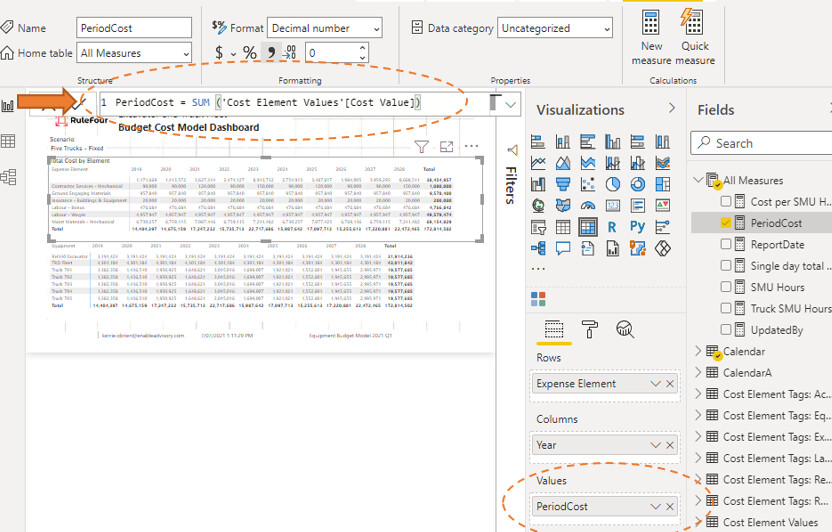
The two most useful measures for use in visuals are PeriodCost = SUM (‘Cost Element Values’[Period Value] and SUM (‘Input Values’[Input Value])
-
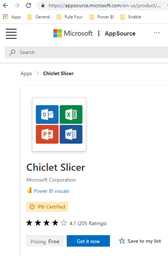
If you would like to apply filters to your visuals with a button download and import the Power BI Chiclet Slicer Add on visual
-
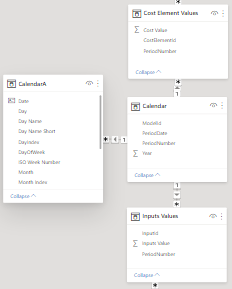
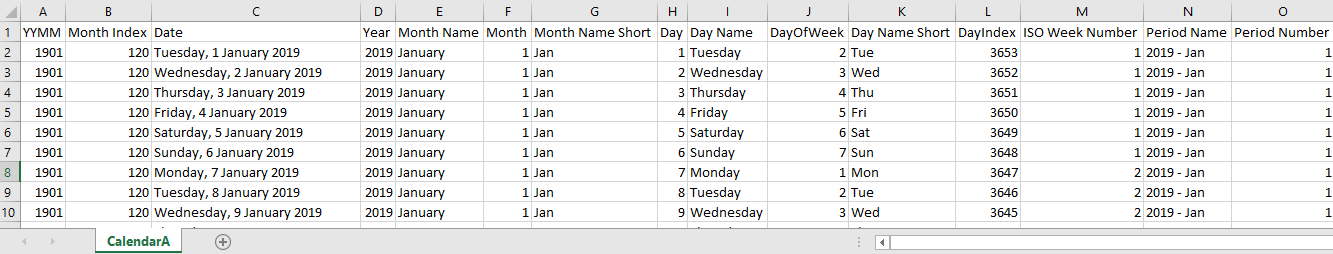
Need the Power BI date functionality? In excel create a calendar table with continuous dates for your entire date range with one column that will correspond to your Period Number. Import to Power BI and link over the period number.
-
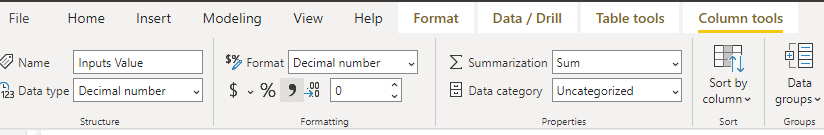
Need your visuals to show numbers with format 12,345,678 and no decimals? You can set this up in Power Query, or by clicking on the field in the visualisation page and choosing Column Tools from the ribbon.

Hope this is helpful. I’ll check back here to add more tips as I learn.